Plotting functions in Octave is quite easy and helpful.
In the lecture on neural networks from Stanford's
machine learning class a function related to neural
networks is introduced. The function has two inputs - x1 and x2 and it's
supposed to model a logical AND operation. The function is based on the
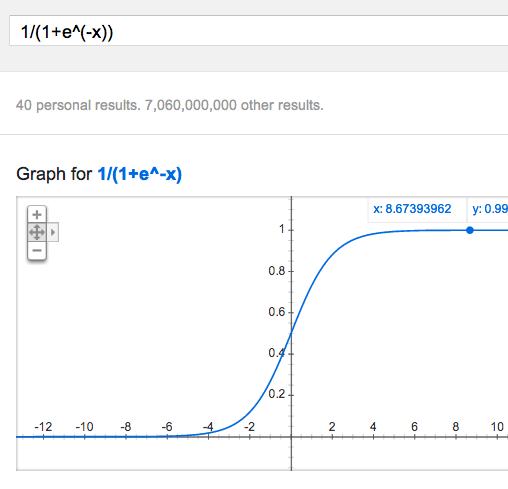
sigmoid function.
The sigmoid function looks like this:
Computing the sigmoid function in Octave can be seen
here.
The given example plugs x1 and x2 into the sigmoid function by
computing:
f(x1, x2) = sigmoid(-30 + 20*x1 + 20*x2)
f(1, 1) evaluates to 1
f(0, 0), f(0, 1) and f(1, 0) evaluate to 0.
Intuitively that make sense. Even if x1 or x2 is 1, -30 + 20 is -10,
which corresponds to a very low value for the sigmoid function, as you
can see from the graph above.
I got curious about how this function looks like for values between zero
and one and wrote this
short Octave
program to plot the output. And here
it is. Pretty neat, I'd say.
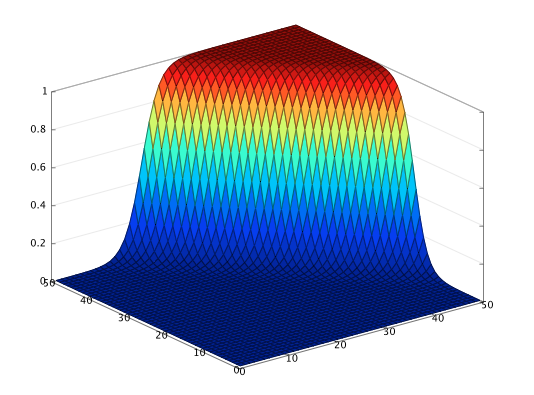
It's easy to see that the function behaves as expected at (0,0), (0,1)
and (1,0) and (1,1) and that for values in between its computed values
are somewhere in between as well.